Mastering Debugging: Essential VS Code Extensions for Development
Search for a command to run...
No comments yet. Be the first to comment.
Computers have been helping us solve problems more quickly and intelligently for decades, but even the supercomputers have their limitations. Quantum computing is a new and exciting technology that has the potential to completely change the rules of ...

Introduction: The Security Issue You Can't Afford to Overlook If you're still sharing the same password across your email, bank, and Netflix account, or if your password is a combination of "Password123," then your security is gravely compromised. W...

Artificial Intelligence (AI) has already been part of our everyday life. From virtual assistants to automated recommendation systems, AI uses various technologies that we use regularly. AI tools like ChatGPT, Google Gemini, and GitHub Copilot have ch...

Building a quantum computer isn’t about power — it’s about survival. 🌪️ The Fragile Nature of Quantum Computers Quantum computers operate on qubits, which can exist in a superposition of 0 and 1.But this power comes with a cost — qubits are incredi...

Technology is progressing at a rapid rate, and so is its energy consumption. From massive AI models running in data centers to billions of IoT devices always online, the IT industry is now one of the largest contributors to global electricity demand....

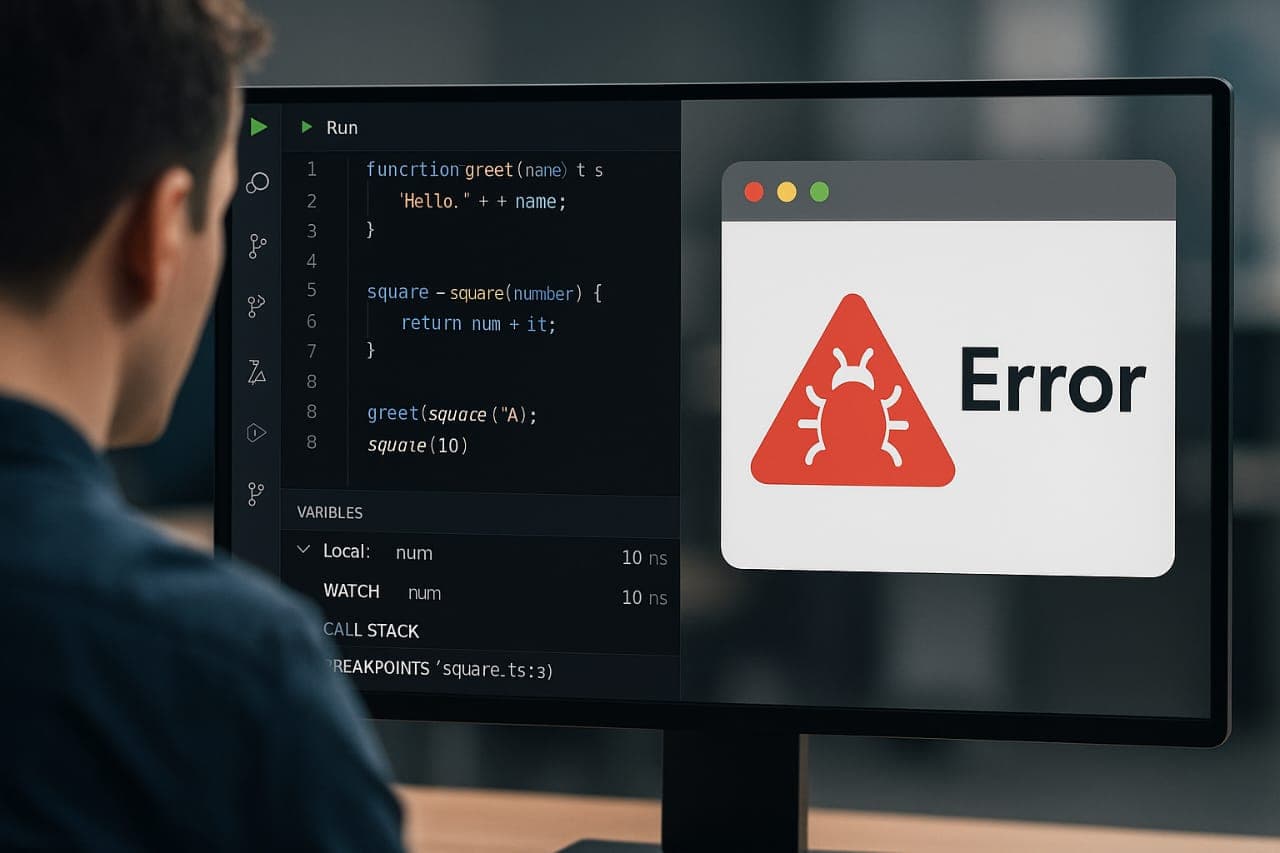
Debugging is the most important aspect of software development. It is the act of finding and fixing errors or bugs in your code, so your applications run smoothly and efficiently. Even if your code looks "perfect" at a glance, if it cannot be traversed causally, it will lead to frustrating user experiences and wasted time for users.
Visual Studio Code (VS Code) is a widely used code editor because of its large collection of extensions. All of these extensions will greatly enhance your coding life, especially in debugging. In this article, we’ll introduce some essential extensions that will help you level up your debugging game.
The extension permits you to debug your JavaScript code in VS Code using the Chrome browser. This extension has made it even more convenient since you can set breakpoints, step through your code, and inspect variables right on your editor. It is JavaScript framework agnostic, thus you can use many different JavaScript frameworks with it.
To begin using the Debugger for Chrome extensions:
Open the Extensions view by clicking on the Extensions view icon in the Activity Bar of VS Code.
Search “Debugger for Chrome” and install the debugger.
After installing, create a launch configuration by going to the Run view and selecting "create a launch.json file."
Choose "Chrome" from the options and customize the configuration in a way that fits you.

Use Breakpoints to halt execution at significant points of your code.
With watch expressions, you can follow the value of the variables as you go along.
This is a wonderful extension to debug your intricate front-end apps, where you will be able to see your changes live while you make modifications in your code.
ESLint is a stock analysis tool for JavaScript code. It helps developers by uninterruptedly examining the code to identify any errors or issues. ESLint is simply called a linter, which is a must-have tool in web development. ESLint corrects and cleans your code from all those pesky errors before they even run. This tool ensures to enforce consistent coding standards by following various predefined rules. These rules are customized as per the project's requirements and therefore improve the overall code quality. So, if you are dealing with JavaScript projects, ESLint is an essential extension for Visual Studio Code (VSC) to have in your arsenal! Here we go with some good points of ESLint that make it stand out from other tools.
To install ESLint:
Open the Extensions view in VS Code.
Search for "ESLint" and install it.
After installation, create an ESLint configuration file in the root of your project to decide your programming standard.

ESLint is used to handle common problems, such as antique variables or incorrect syntax, even before running your code.
Combine ESLint with other debugging tools, such as Chrome debuggers, for a more comprehensive debugging process.
Real-world examples include capturing typing or logical errors that may cause operation time problems.
GitLens is an extension that adds more features to basic Git functions in VS Code. It demonstrates the notion of changes in ownership and coding history, for you to better understand the background of your coding. Knowing that a bug was fixed can be very useful because now you can see when, why, and how it was fixed.
To install GitLens:
Open the Extensions view in VS Code.
Search for "GitLens" and install it.
After customizing, you can customize the settings to suit your choice.

Use GitLens to monitor changes and determine when bugs were introduced.
Analyze the history of the code to understand the development of your code, which can provide hints for troubleshooting.
Reviewing the complete commit history to know which recent changes might have caused the problem.
In this blog, we looked at some awesome VS Code extensions for supercharging your debugging skills. From the Debugger for Chrome to GitLens, every new tool has its own functionality that can help you save time tracking down and resolving bugs. Good debugging tools are key to any developer and spend some time playing and testing these extensions to see which one fits your workflow.